5.1 The COBE satellite
The Cosmic Background Explorer satellite (COBE) was launched on 18th November 1989. Primordial
anisotropy measurements are made using the DMR experiment, which consists of six differential microwave
radiometers, two at each of 31.5 GHz, 53.0 GHz and 90.0 GHz. The first-year COBE observations provided
convincing statistical evidence for the existence of CMB fluctuations. It was not however, possible to see
individual CMB features, on the scale of the beam size, in the DMR maps, because even combining all of
the maps together, the noise level per beam area was  and the signal to noise remained less than
one.
and the signal to noise remained less than
one.
The results of the analysis of all four years of DMR data have now become available. A convenient
summary of all the results is given in Bennett et al. (1996) [9 ]. On a statistical level, the results can be used
to constrain the normalisation of a power law primordial spectrum. For a given slope
]. On a statistical level, the results can be used
to constrain the normalisation of a power law primordial spectrum. For a given slope  , normalisation is
usually expressed via the implied amplitude of the quadrupole component of the power spectrum,
, normalisation is
usually expressed via the implied amplitude of the quadrupole component of the power spectrum,  , as
, as
where  is the mean CMB temperature. (Note that this
  value need not be the same as the
actual quadrupole component. The fit is to a whole power spectrum as parameterised by a given
value need not be the same as the
actual quadrupole component. The fit is to a whole power spectrum as parameterised by a given
 ). For an assumed value of
  , (the Harrison–Zel’dovich value), Bennett et al. quote
 . The joint best fit values of
  and
and  are
are  and
and
 . This restriction on the value of
  is of course of great interest in the
context of inflationary predictions that
is of course of great interest in the
context of inflationary predictions that  . It is also of interest that inflation predicts
Gaussian fluctuations, and while this is much harder to test for than finding the amplitude and
slope of the spectrum, the data are also consistent with this prediction. Specifically, Bennett
et al. state ‘statistical tests prefer Gaussian over other toy statistical models by a factor of
. It is also of interest that inflation predicts
Gaussian fluctuations, and while this is much harder to test for than finding the amplitude and
slope of the spectrum, the data are also consistent with this prediction. Specifically, Bennett
et al. state ‘statistical tests prefer Gaussian over other toy statistical models by a factor of
 5’.
5’.
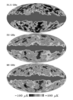
With the accumulation of four years of data, the individual anisotopy features within the maps on the
scale of the beam size are now becoming statistically significant. Figure 11 shows the all-sky maps at each
frequency taken from Bennett et al. [9]. Some of the features in these maps away from the Galactic plane
are expected to be real CMB fluctuations, since the signal to noise in these regions is now about 2 sigma per
10 degree sky patch. Indeed, features which repeat well between the different frequencies are now clearly
visible.